Twitter Ads Manager provides a central workspace to plan, manage, and report on campaigns.
You can access Ads Manager by logging into your ads account at ads.twitter.com, where you’ll automatically be brought to the Ads Manager as your home screen. From there, you can customize your view to see relevant campaigns, creatives, and results.
Ads Manager features
Custom filters
Use campaign filters across the top of Ads Manager to easily find the campaigns, ad groups, and/or ads you want to evaluate. You can filter campaigns by:
- Funding source
- Objective
- Status
- Campaign name
Add as many filters as you want by clicking “Add filter”.
You can also save these filters to easily go back to any filtered view. Filter sets are unique to each advertiser.
Custom metrics
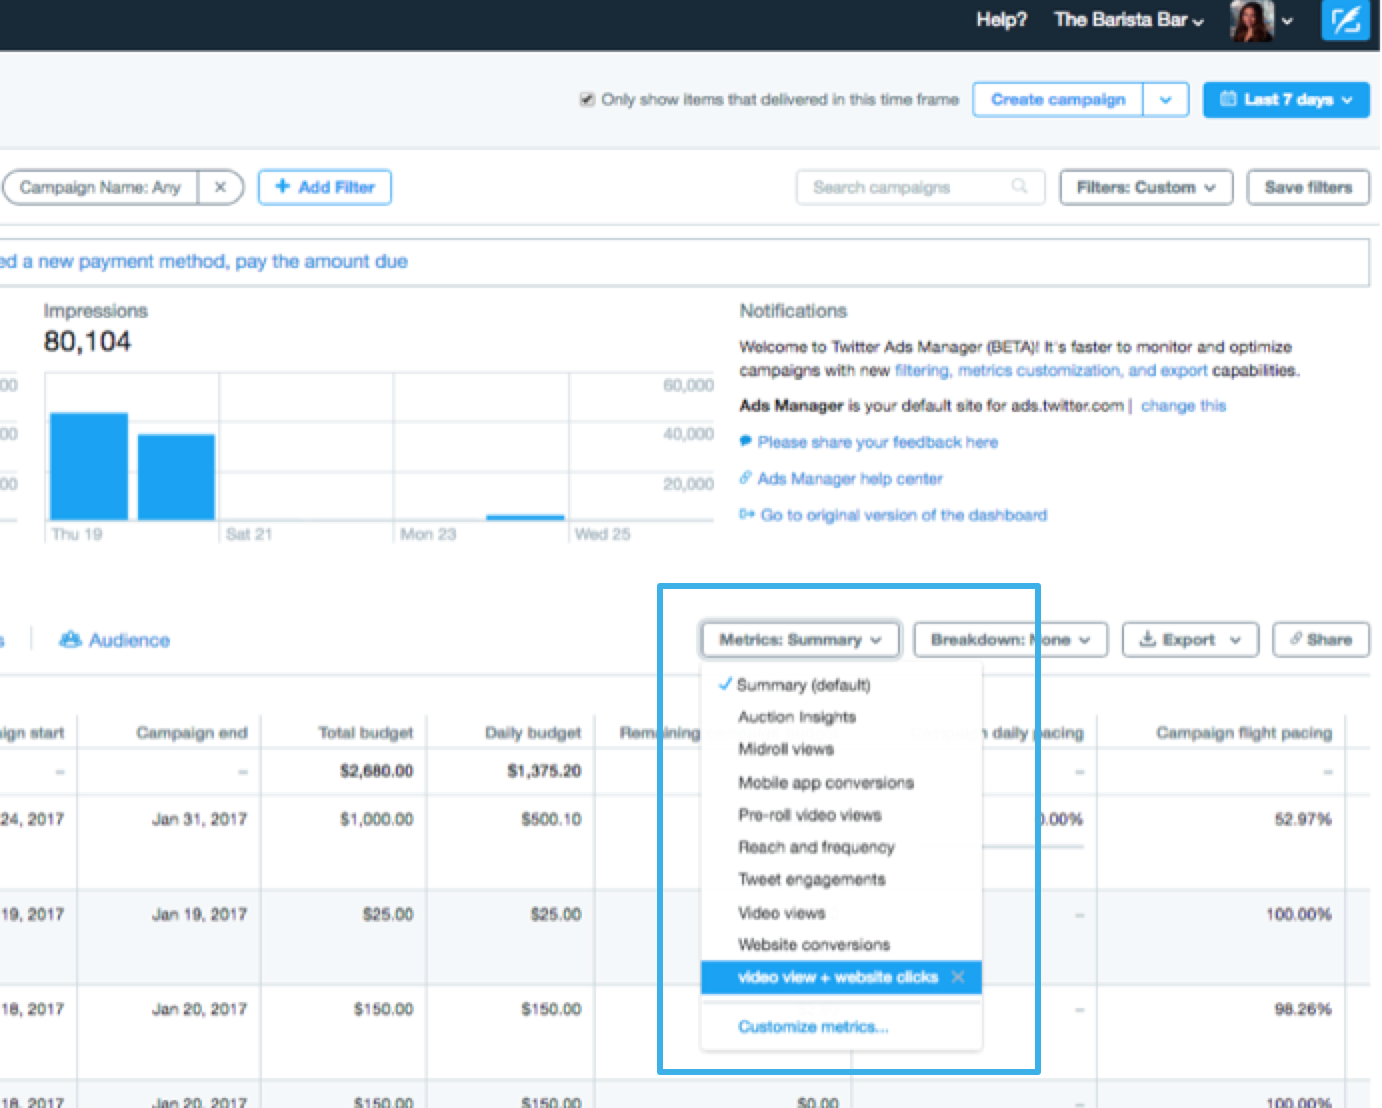
By default, you’ll see all results, cost per result, and result rate – by objective.To view preset metrics by objective, click on the objective in the “Metrics: Summary” drop-down.
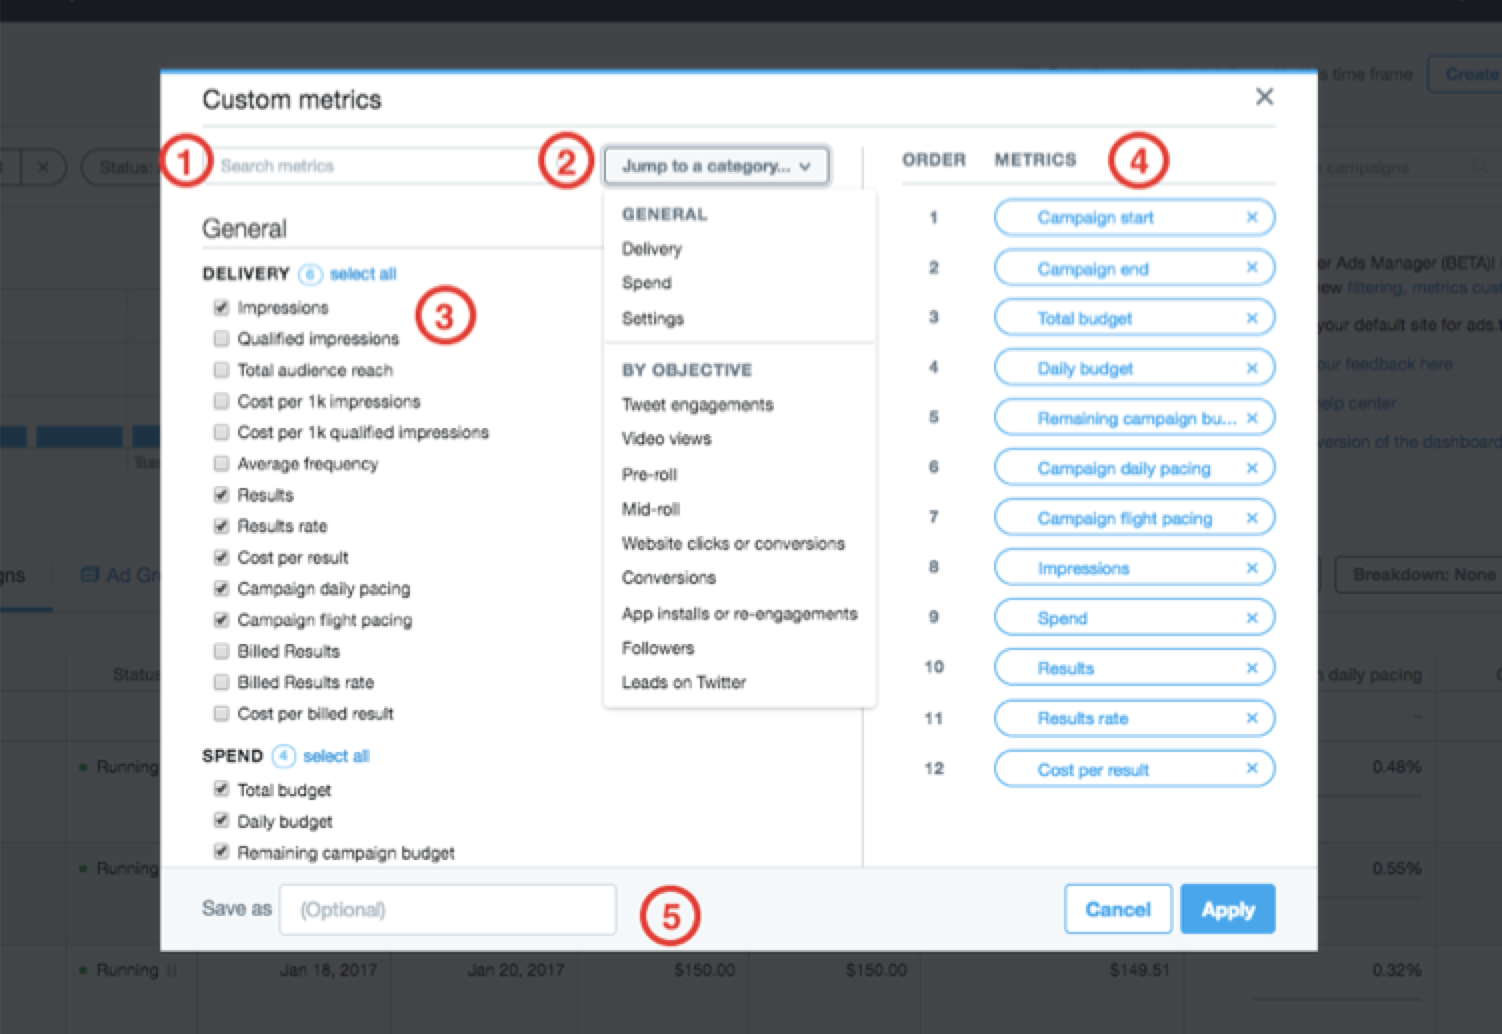
You can also view a number of other metrics for your campaign by clicking on “Customize metrics”. Here, you can select or unselect any metric you wish.
It’s also possible to save your selection of metrics as a custom report. Save your preset by entering in a name for the selections and click “Save”. Custom reports allow you to go back to that metric set anytime for fast campaign analysis.
Campaign structure
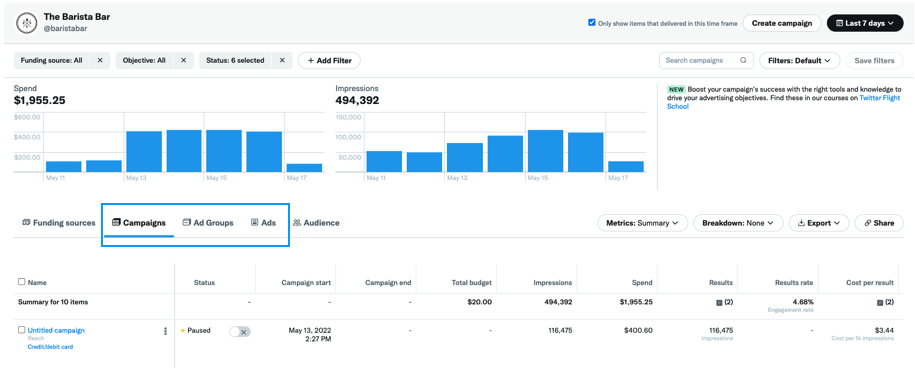
We provide various levels in our campaign structure, designed to give you as much control as possible of how your Twitter activations deliver.
Campaign: A campaign corresponds to a single advertising objective, like followers, video views or app installs. At the campaign level, you always specify your campaign name and chosen funding source.
Ad groups: Ad groups are where you choose how you want to spend your money. Here you set goals, bids, targeting and placement for each of your campaigns. One campaign can have many ad groups and an ad group can contain one or more Ads.
Ads: You can have as many Ads as you would like in a single ad group. The system will auto-optimize to the best performing creative within an ad group.
You can view performance for each ad, filtered by creative type:
- Tweets: Promoted Ads
- Display creatives: Creative used on the Twitter Audience Platform
- Amplify Pre-roll: Pre-roll video used in an Amplify Pre-roll campaign
How to select and view custom metrics
Custom metrics model
Our custom metrics model allows you to:
- Search metrics by name
- Use the categories to navigate through available metrics
- Add and remove metrics
- Change the order of the columns by dragging and dropping. Top to bottom in the model corresponds to left to right columns in the dashboard
- Save your custom metric set
Once you’ve saved a metric set, it’ll be available in the metrics drop-down with your other presets.
You can share a view by clicking the “Share” button to the right of “Export”. This allows anyone with access to the account to see the view you created.
Campaign sorting and metric definitions
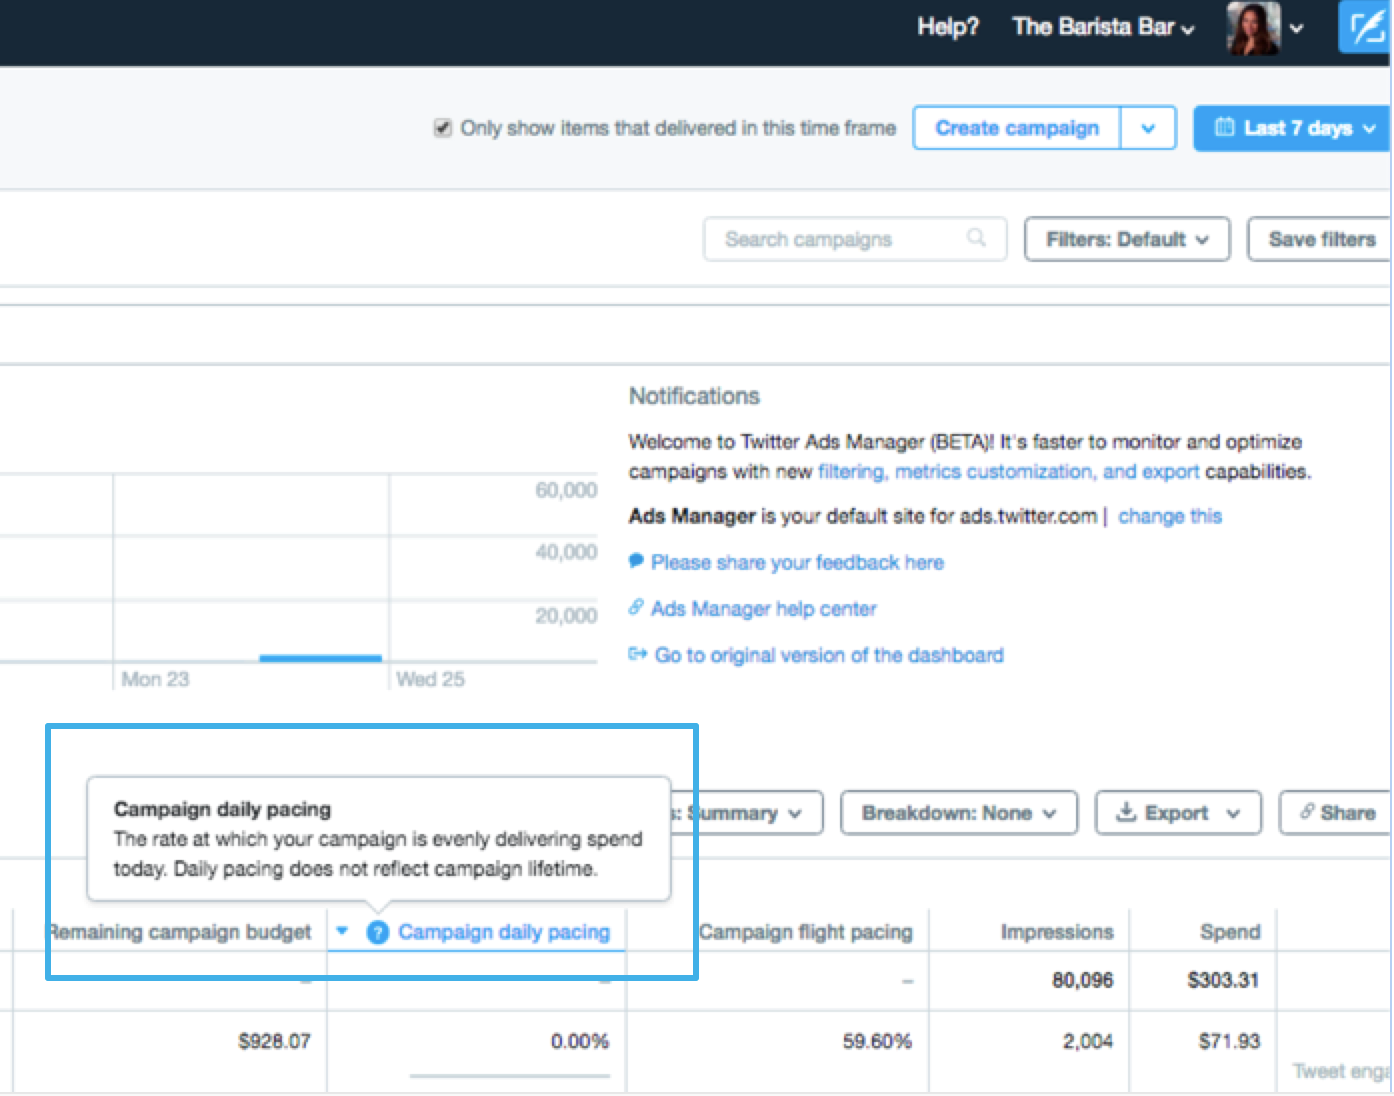
- Click on the “▼” icon to sort a column
- Hover over the “?” icon to see a definition of each metric
- These tips are also available if you hover over a metric in the metrics customization model
- Note: sorting is maxed at 2500 rows
Audience details
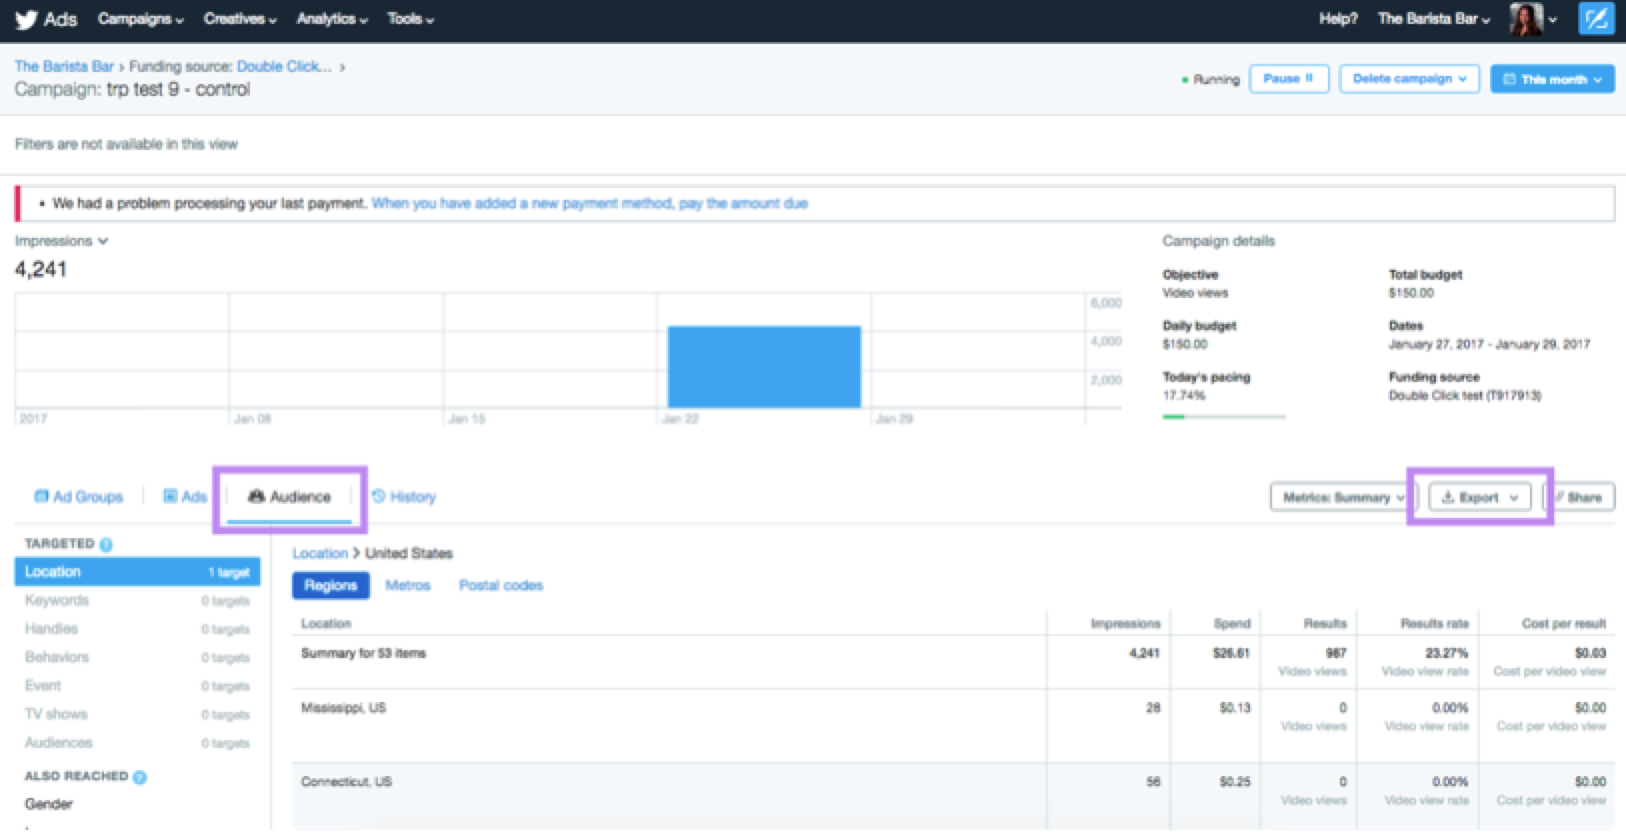
You can view audience breakdown by locations, keywords, handles, behaviors, gender, language, platform, and interests.
Click on the “Audience” tab to view audience details. To export data at the audience level, click on the “Export” button on this page.
Activity history
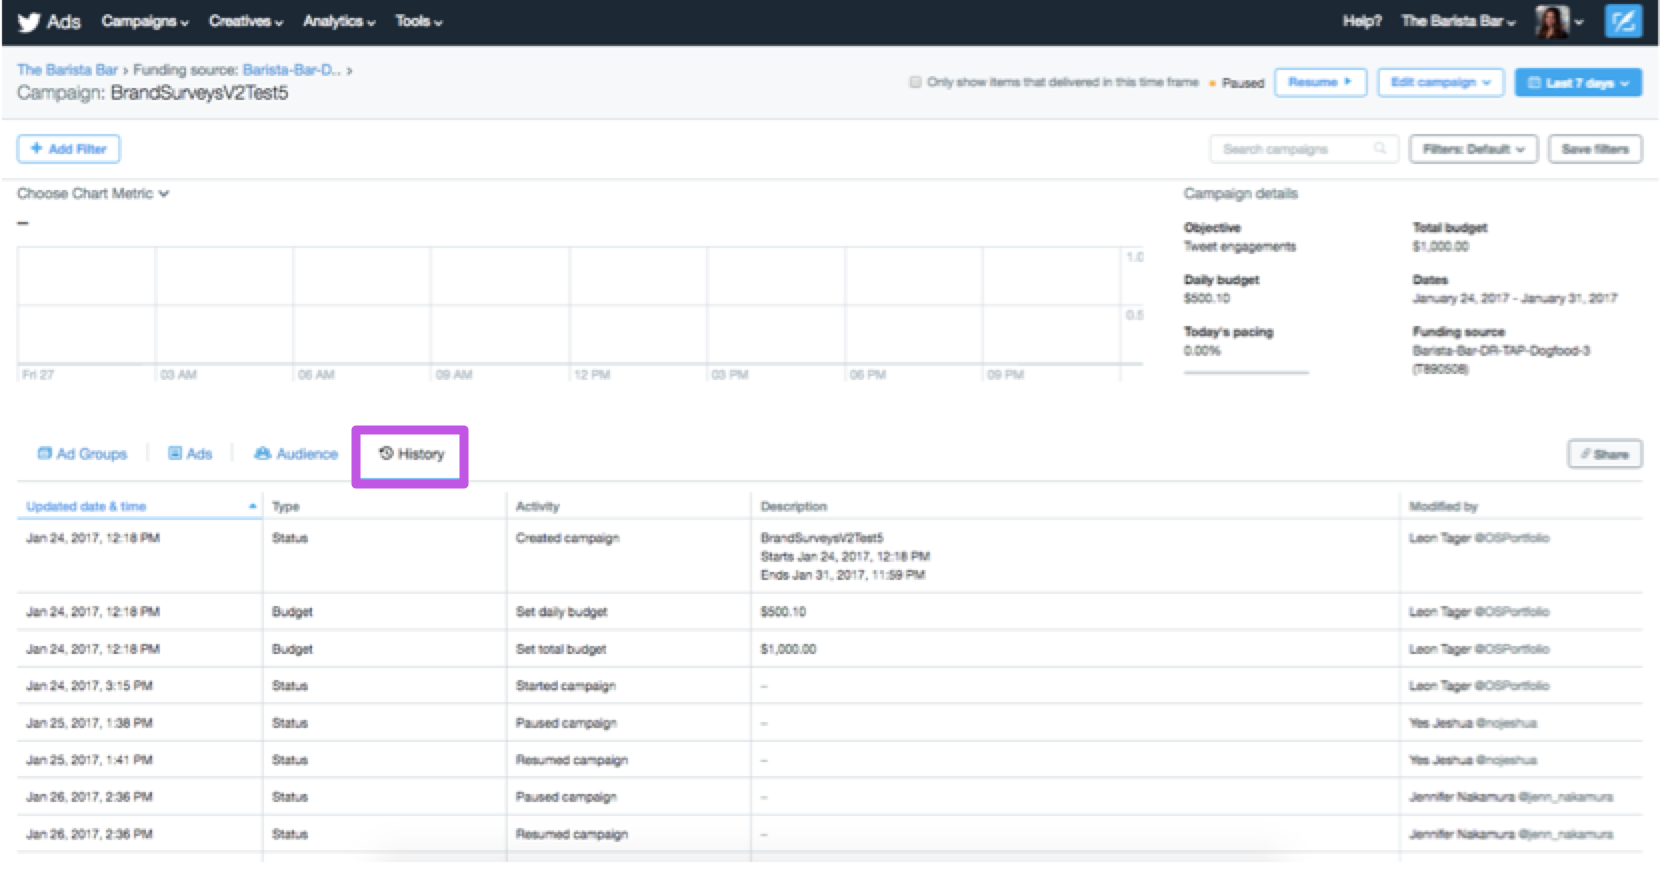
View what changes were made to your campaign or ad group, and see which optimizations were made and by whom.
Click into an individual campaign or ad group to see the history log.
Breakdown by day, placement, device, and creatives
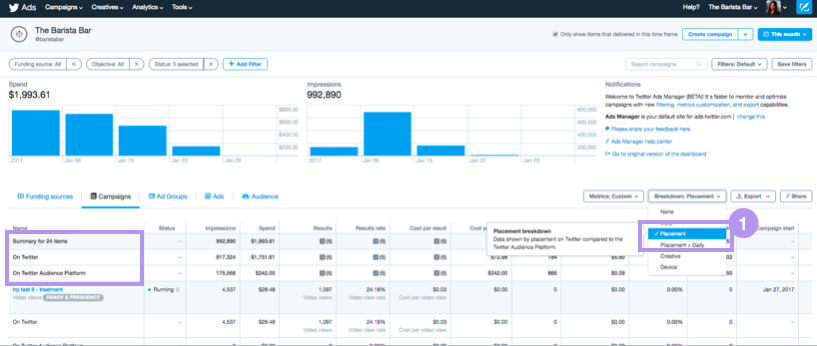
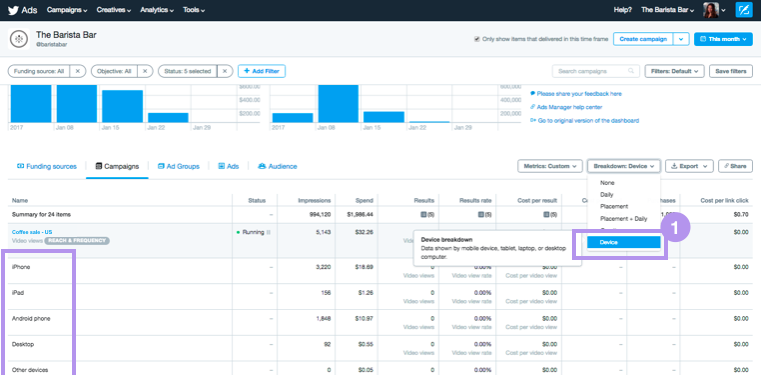
See your results on Twitter vs. Twitter Audience Platform, Android vs. iPhone, or by creative.
Breakdown by placement: Navigate to “Breakdown: Placement” and click on “Placement” or “Placement + Daily”. The dashboard will show a breakdown between Twitter and Twitter Audience Platform delivery for each level of the campaign structure: funding sources, campaigns, ad groups, and ads.
Breakdown by device: Navigate to “Breakdown” and select “Device”. The dashboard will show a breakdown between devices (Android vs. iPhone) for each level of the campaign structure: funding sources, campaigns, ad groups, and ads.
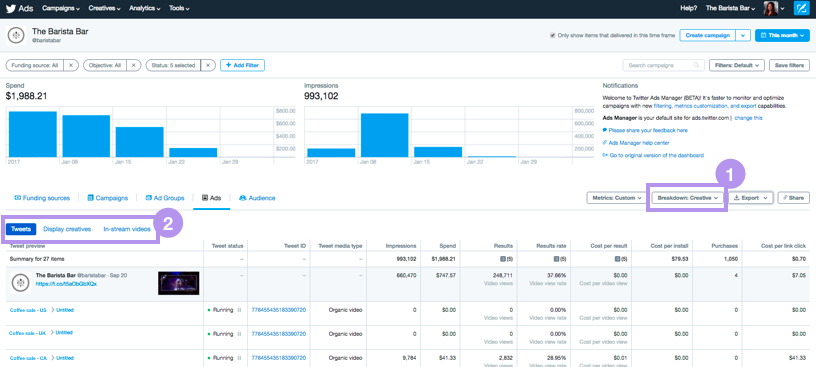
Breakdown by creative: To view aggregated Tweet data across campaigns, select “Breakdown: Creative”.
Remember to toggle to Tweets, pre-roll, or other display creatives depending on the type of media you want to view. You can add Tweet ID and Tweet media type as custom columns to enable easy filtering and sorting.
Customize charting
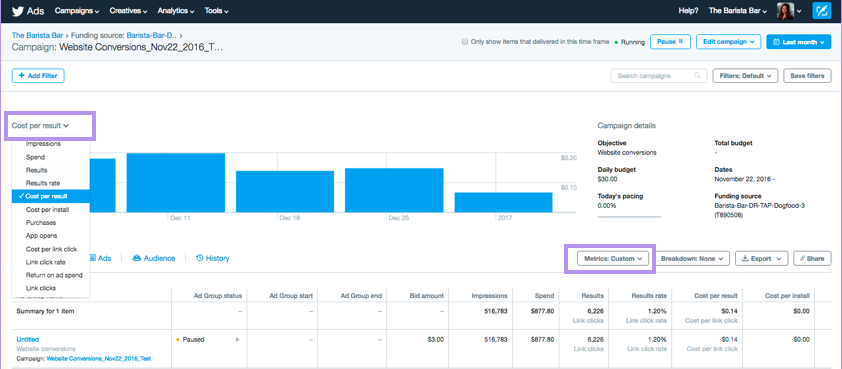
You can customize charts to visualize your key KPIs.
At the campaign, ad group, and ads levels, click on the drop-down at the top of the chart to select the metric you want to visualize. You can customize the list of metrics you see by adding them through the custom metrics model.
How to export your data
You can report on campaign lifetime data instead of hourly or daily breakouts for faster analysis:
- Use custom filters and metrics to create your dashboard view
- Click “Export” and navigate to “Export data”
- Select “Breakdown: None” to export exactly what you see in the dashboard
You cam also download audience metrics.
Please note: Data for website conversions by tag is only available via export. We recommended you use the universal website tag to view conversion data in the UI.